

Importance (A-F): This release merits a C+.
Source: The Census Bureau and the Bureau of Economic Analysis of the Department of Commerce.
Release Time: 8:30 ET around the 20th of the month (data for two months prior).
Raw Data Available at: www.census.gov
The trade report is most widely watched for trends in the overall trade balance. But trends in both exports and imports of goods and services bear watching as well. The export data in particular are important to watch for indications that a strengthening competitive position at home and/or strengthening economies overseas are boosting U.S. growth. Imports provide an indication of domestic demand, but given the severe lag of this report relative to other consumption indicators, it is not particularly valuable for this purpose.
The volatility in the monthly trade balance can play an important role in GDP forecasts. Net exports are a relatively volatile component of GDP, and the trade report provides the only early clues to the net export performance each quarter.
11 mar 2010
10 mar 2010
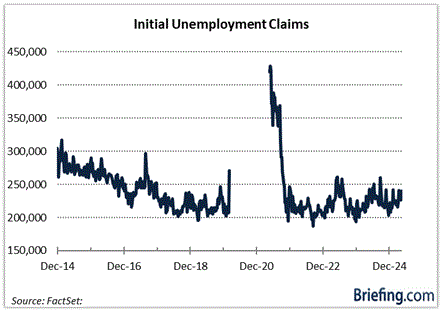
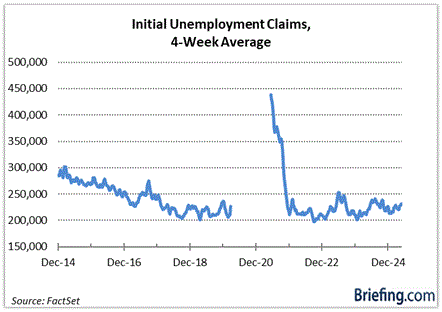
Initial Jobless Claims
Importance (A-F): This release merits a C+.
Source: The Employment and Training Administration of the Department of Labor.
Release Time: 8:30 ET each Thursday (data for week ended prior Saturday).
Raw Data Available at: www.dol.gov
Initial jobless claims measure the number of filings for state jobless benefits. This report provides a timely, but often misleading, indicator of the direction of the economy, with increases (decreases) in claims potential signalling slowing (accelerating) job growth. On a week-to-week basis, claims are quite volatile, and many analysts therefore track a four week moving average to get a better sense of the underlying trend. It typically takes a sustained move of at least 30K in claims to signal a meaningful change in job growth.
There are two other statistics in this report -- the number of people receiving state benefits and the insured unemployment rate; neither is watched closely by the market. Some analysts track the number of people receiving state benefits from month to month as a guide for job growth, though this series has a poor track record in predicting the monthly employment report. The insured unemployment rate changes little on a weekly basis and is never a factor for the market.
Industrial Production
Importance (A-F): This release merits a B-.
Source: Federal Reserve.
Release Time: 9:15 ET around the 15th of the month (data for month prior).
Raw Data Available at: www.federalreserve.gov
The index of Industrial Production is a fixed-weight measure of the physical output of the nation's factories, mines, and utilities. Manufacturing production, the largest component of the total, can be accurately predicted using total manufacturing hours worked from the employment report. One of the bigger wildcards in this report is utility production, which can be quite volatile due to swings in the weather. Severe hot or cold spells can boost production as increased heating/cooling needs drive utility production up.
In addition to production, this monthly report also provides a measure of capacity utilization. Though the rate of capacity utilization is seen as a critical gauge of the slack available in the economy, the market does not completely trust this measure. Capacity is very difficult to measure, and the Fed essentially assumes that growth in capacity in any given year follows a straight line. One can therefore predict the capacity utilization rate quite accurately based on the assumption for production growth. The 85% mark is seen as a key barrier over which inflationary pressures are generated, but given revisions to these data and the difficulties with capacity measurement, the 85% mark should be viewed cautiously. It would be appropriate to look for corroborating inflation indications from commodity prices and vendor deliveries.
Why Trade Currencies?
Forex is the world’s largest market. With about 3.2 trillion US dollars in daily volume and 24-hour market action, we believe it is a true “step above” the equities market for the serious trader. Some key differences are:
* Many firms don’t charge commissions – you pay only the bid/ask spreads.
* There’s 24 hour trading – you dictate when to trade and how to trade.
* You can trade on leverage, but this can magnify potential gains and losses.
* You can focus on picking from a few currencies rather than from 5000 stocks.
* Forex is accessible – you don’t need a lot of money to get started.
Why Currency Trading Is Not For Everyone
Trading foreign exchange on margin carries a high level of risk, and may not be suitable for everyone. Before deciding to trade foreign exchange you should carefully consider your investment objectives, level of experience, and risk appetite. Remember, you could sustain a loss of some or all of your initial investment, which means that you should not invest money that you cannot afford to lose. If you have any doubts, it is advisable to seek advice from an independent financial advisor.
9 mar 2010
Housing Starts & Building Permits
Importance (A-F): This release merits a B-.
Source: The Census Bureau of the Department of Commerce
Release Time: 8:30 ET around the 16th of the month (data for one month prior).
Raw Data Available at: www.census.gov
Housing Starts are a measure of the number of residential units on which construction is begun each month. A start in construction is defined as the beginning of excavation of the foundation for the building and is comprised primarily of residential housing. Building permits are permits taken out in order to allow excavation. An increase in building permits and starts usually occurs a few months after a reduction in mortgage rates. Permits lead starts, but permits are not required in all regions of the country, and the level of permits therefore tends to be less than the level of starts over time.
The monthly national report is broken down by region: Northeast, Midwest, South, and West. Briefing recommends analyzing the regional data because they are subject to a high degree of volatility. The high volatility can be attributed to weather changes and/or natural disasters. For example, an unexpectedly high level of rain in South could delay housing starts for the region.
Gross Domestic Product - GDP
Importance (A-F): This release merits a B.
Source: Bureau of Economic Analysis, U.S. Department of Commerce.
Release Time: Third or fourth week of the month at 8:30 ET for the prior quarter, with subsequent revisions released in the second and third months of the quarter.
Raw Data available at: www.bea.doc.gov
Gross Domestic Product (GDP) is the the broadest measure of economic activity. Annualized quarterly percent changes in GDP reflect the growth rate of total economic output. The figures can be quite volatile from quarter to quarter. Inventory and net export swings in particular can produce significant volatility in GDP. The final sales figure, which excludes inventories, can sometimes be helpful in identifying underlying growth trends as inventories represent unsold goods, and a large inventory increase will boost GDP but might be indicative of weakness rather than strength. The broad components of GDP are: consumption, investment, net exports, government purchases, and inventories. Consumption is by far the largest component, totalling roughly 2/3rds of GDP.
In addition to the GDP figures, there are GDP deflators, which measure the change in prices in total GDP and for each component. Though the consumer price index is a more closely watched inflation indicator, the GDP deflator is another key inflation measure. Unlike CPI, it has the advantage of not being a fixed basket of goods and services, so that changes in consumption patterns or the introduction of new goods and services will be reflected in the deflator.
With both GDP and the deflator, the market tends to focus on the quarter/quarter change. Year/year changes are also cited frequently, though they do not provide the most timely indications of economic activity or inflation. The bond market often reacts to GDP, though the price moves are typically small, as much of the GDP data is easily predicted using monthly economic releases such as personal consumption, durable goods shipments, construction spending, international trade, and inventories.
Quarterly GDP reports are broken down into three announcements: advance, preliminary, and final. After the final revision, GDP is not revised again until the annual benchmark revisions each July. These revisions can be quite large and usually affect the past five years of data.
Factory Orders
Importance (A-F): This release merits a D+.
Source: The Census Bureau of the Department of Commerce.
Release Time: 10:00 ET around the first business day of the month (data for two months prior).
Raw Data available at: www.census.gov
Factory orders consist of the earlier announced durable goods report plus non-durable goods orders. The report is very predictable with nondurables the only new component. Nondurables consist of such items as food and tobacco products which grow at a fairly consistent monthly rate, so that market forecasts for this report are far more accurate than for the durable orders report. In addition to seeing nondurables for the first time, the market also watches for revisions to the durable orders data, which can be significant. At present, durable goods orders sum to about 54% of total orders.
The final piece of new information in this report is factory inventories - the first glimpse at the inventory picture each month (wholesales inventories are typically released a week later, with retail inventories released a few days after wholesale inventories). Though the inventory figure is not a market-mover, economists use this number to help forecast inventories in the quarterly GDP report.
Suscribirse a:
Entradas (Atom)

